At my company we’ve been using tools like Munin to monitor the server. Munin is a great tool that shows all type of graphs of what’s going on in the server: Apache processes, Varnish memory, Database performance, Server load, Disk usage, Memcache performance… and a lot more. Basically, you can configure any service you have so that Munin can generate graphs.
But Munin only informs us about server stuff. It doesn’t really provide any type of information of the applications running on the server:
- Application performance
- Server/Application errors
- External services
- Database queries performance
- Slowest pages
- Browser performance (including JS errors)
- and many more…
This is where New Relic becomes a very handy tool.
About New Relic
First of all, I’d like to clarify that this is not a ‘commercial’ post. I’m just explaining my experience and why I think New Relic is a good tool. I know there are other tools that might be similar, and maybe they’re even better than New Relic. But New Relic is the tool I’ve been working for many months, and I wanted to share how happy I am with it.
That said, New Relic is a tool that covers a very wide areas related to web applications: server monitoring, application monitoring, analytics, deployment monitoring and many more (actually, in this post I just wanted to talk about the area I’m interested in: how useful it’s to monitor Magento).
New Relic is kind of expensive, or not. That depends on how much money you make. However, there is a free option (yes!) which offers 24h data. You have the base tool functionalities with a 24h data retention, which is fair enough in many cases.
How New Relic help us with Magento
We talk about «Magento» but it could be any other application. I’ll go directly for practical examples:
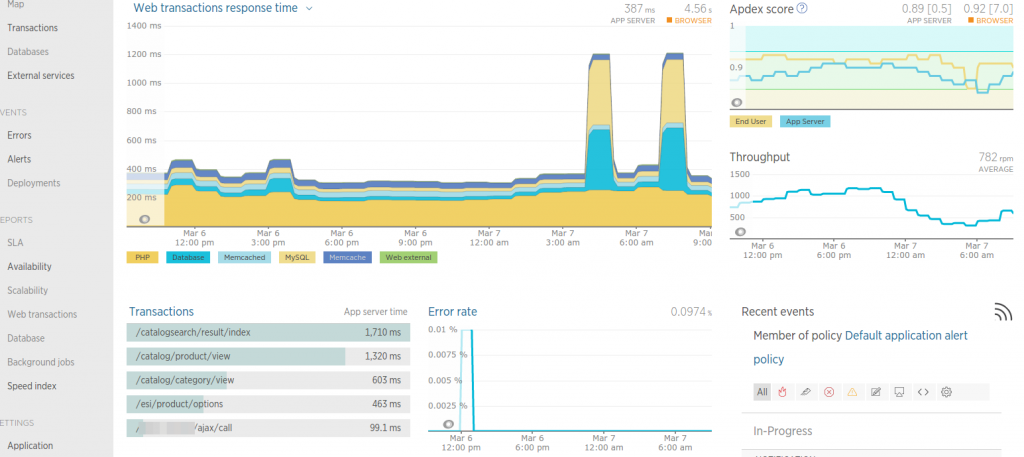
- First thing in the morning, what I do is to check the server load graph of the last 24h. As we can see in the screenshot below, we get a clear view of what’s been going on during this time. We also see slowest transactions (oh no! our search is not performing well!). The error rate graph is very useful too: it let us know immediately whether there is a problem on the website or not related to the code.
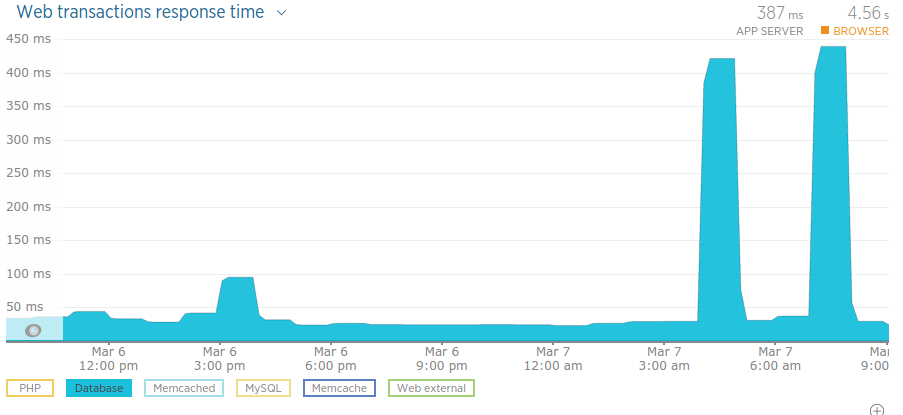
- Directly from this page we can also «filter» by service to know which service is taking more/less time in the server response total time. If I disable in the graph PHP and Memcache, I see that the peaks at night are related to the database. But why do I have these peaks? Ah, OK, the database backup.
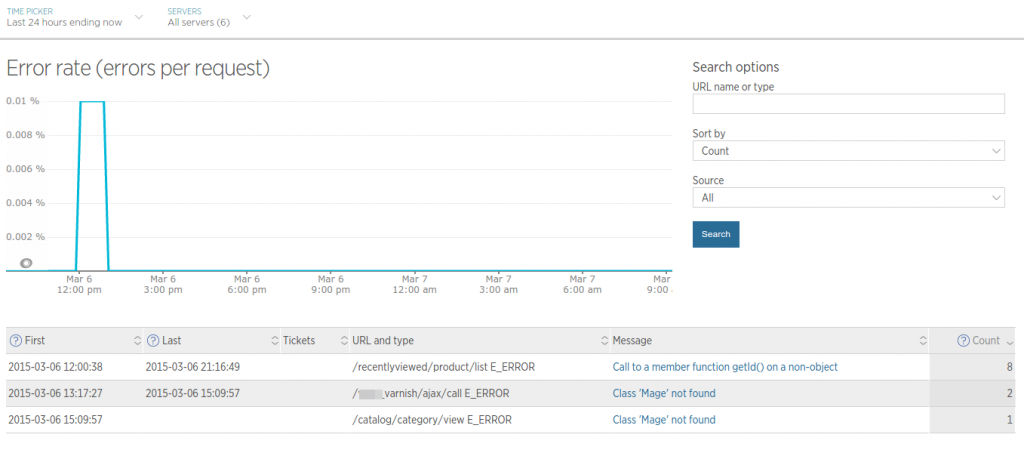
- Let’s go to the errors section. We’re doing fine. 11 errors in a website which receives millions of page views per day. In any case it’s interesting to check what is causing these 11 errors. On the one hand, we see that the recently products block seem to not be correctly handling a specific case when the object is empty. We’ll correct that. On the other hand, we see some weird errors «Class ‘Mage’ not found». This is an ongoing investigation since a few months. In our applications we’re not getting the actual error in many cases and we end up with that annoying «Class ‘Mage’ not found». I asked the stackoverflow community a few months ago, but there was no answer. I created this other post to list some of the possible reasons. I think that this might be related to a server configuration…
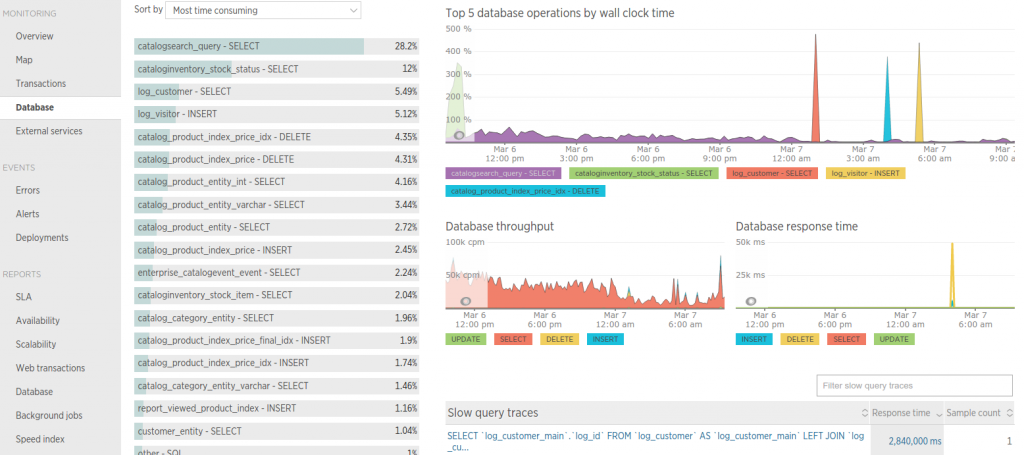
- Now we’ll check the database performance. The following graph is from other project that is not performing very well (actually, it’s kind of a disaster…). New Relic informs us about the slowest queries, which queries are the most common, the time they require, etc… Great stuff. We can see that one of the slowest queries is related to the magento logging actions! It might be interesting to just disable Magento customer logging (we usually do that in all our projects).
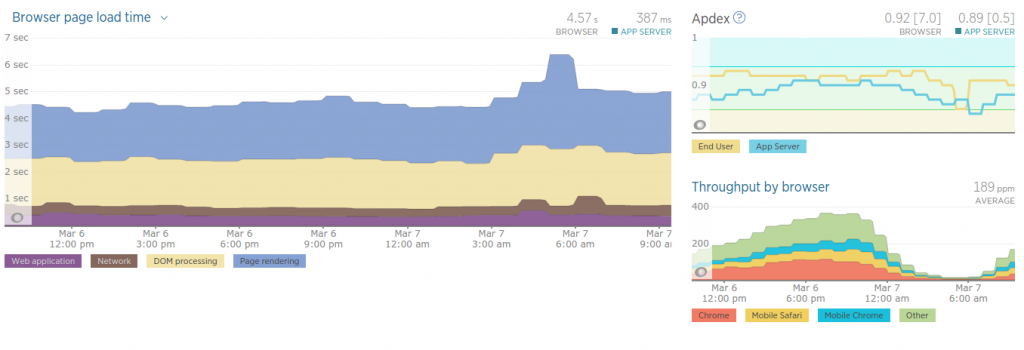
- Knowing server performance is good. But what about browser performance? Let’s go to the Browser sights and we’ll see. New Relic provides information about the page rendering, Dom processing, Network. And we can see how this has been in the last 24 hours. This is just the first view, but we can also get much more information.
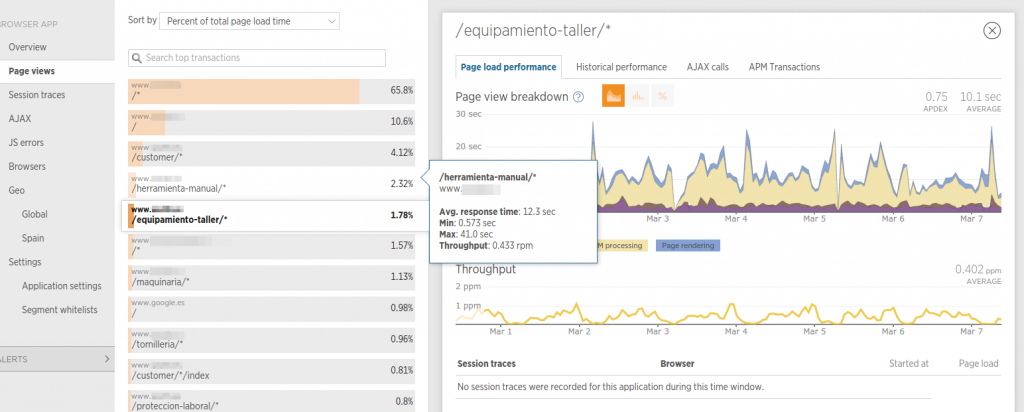
- We can even get which urls are the slowest ones:
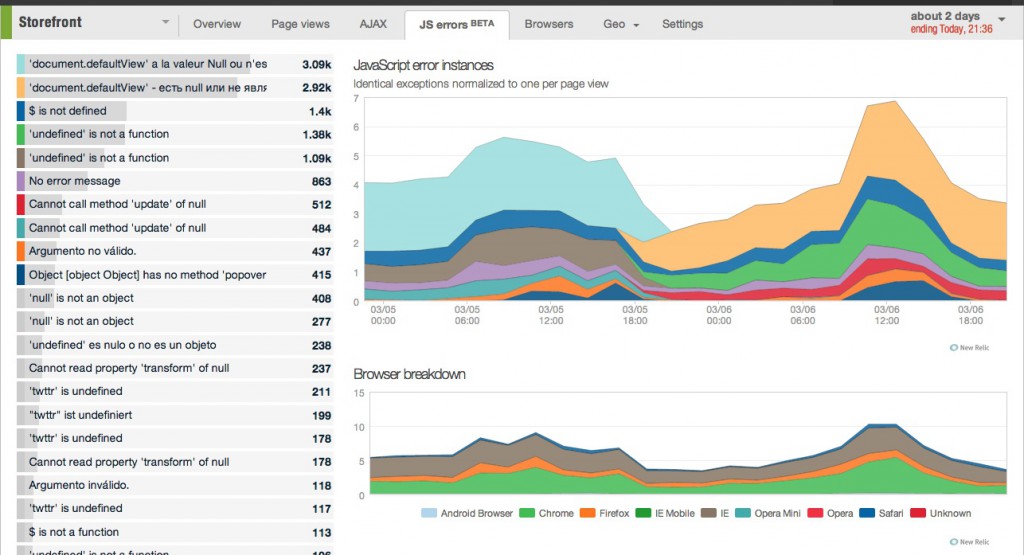
- There are also reports related to the JS errors. This is really great to analyze something that it’s kind of harder to spot when we check server logs or graphs. Checking my apps, everything seems to work fine, so I just will get the example from New Relic:
What else?
Actually, much more. What I’ve mentioned here is a very small part of what New Relic can offer us. It’s a very interesting tool for developers, but also for your customers. I can assure you that the free version will be very useful for you. Easy to install and configure. Isn’t that great?
I know, it’s seems like I’m selling New Relic… and I’m not. I just wanted to share a tool that has helped me working with Magento, saving me a lot of time, and letting me know about disasters before they happen.
Pretty nice tool. Good job.
0 Comments